
The Million Neighborhoods Initiative addresses the challenge of slums and urbanization through the localization of the United Nations’ Agenda 2030 for Global Sustainable Development. It builds a common framework based on extending human capabilities, tools, and data for mapping, urban planning, and coordinating neighborhood solutions to development.
Million Neighborhoods Africa
Rapid urbanization in Africa and Asia over the last few decades has led to massive shifts in population and the rise of informal settlements that operate without roads, power and sewer lines. In neighborhoods such as Kibera, Nairobi, and West Point, Monrovia, homes are so densely packed that it can be challenging for residents and resources to move through the community, and difficult for urban planners to identify the best areas to build roads, water pipes, power and sewage lines. The issue is more pressing than ever, as the number of people living in these settlements is expected to triple to three billion in the next 30 years if no large-scale action is taken. Without access to basic infrastructure, residents of informal settlements are more vulnerable to health risks and the impacts of climate change, including flooding, extreme heat and natural disasters.
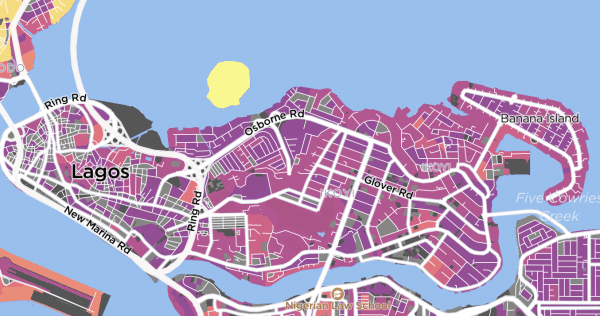
The Million Neighborhoods Africa map of Lagos, the largest city in Nigeria
Million Neighborhoods Africa provides the first-ever map of population and urban development at the street-block level for all of sub-Saharan Africa. The map uses a novel approach to estimate population and measure how well connected buildings are to surrounding street networks. Understanding the degree to which buildings access streets can reveal information about the well-being of people living in those areas since streets provide the infrastructural basis for critical public services such as piped sewers, water lines, transit systems, waste collection, and emergency services. Bringing together geospatial algorithms, large scale datasets, and population censuses, this site simplifies the challenge facing planners hoping to determine which areas in their city lack critical public services and the communities advocating for upgrades within their neighborhood.
The Million Neighborhoods Africa map was developed by a team of researchers at the University of Chicago, including faculty, staff, and students at the Mansueto Institute for Urban Innovation and Open Spatial Lab at the Data Science Institute (OSL) in consultation with international partners, particularly Slum/Shack Dwellers International (SDI). Computational resources were made available through generous support from the Research Computing Center (RCC).
Measuring Human Development in Cities & Neighborhoods
The Community Human Development Index is a way of measuring human development at the community level, with the potential for helping neighborhoods and societies address disadvantage. The human development index (HDI) is a statistic that represents a composite of educational attainment, life expectancy, and gross income, and is considered the gold standard measure of human development. It was developed by Indian economist and philosopher Amartya Sen and researchers at the United Nations Development Program (UNDP) to measure “human capabilities”, the extent to which a person in a specific context can pursue their happiness. It is, in the words of UNDP, a measure of “a long and healthy life, being knowledgeable, and having a decent standard of living.” HDI has been used to compare nations, but until the Community Human Development Index, it hasn’t been used to compare cities or local communities, because the statistic had not been calculated at the neighborhood level.

The Community HDI starts with the United States, where data is available for all of the data points measured in the HDI through the Census. The map “localizes” HDI by calculating it for every U.S. Census tract —a total of over 70,000 communities and each U.S. metropolitan area. Our interactive map allows users to compare different neighborhoods and benchmark them to international HDI values.
We are pursuing similar strategies to measure human development in other nations, with a goal of creating a global picture of localized human development. With this tool, we hope to inspire researchers, community leaders, policymakers, and other stakeholders to make human development a more prominent priority in urban development and devise more comprehensive approaches to practice and policy.
Research
For the science behind our work, read the following papers:
Suraj K. Sheth, Luís M. A. Bettencourt. Measuring Health and Human Development in Cities and Neighborhoods in the United States. npj Urban Sustainability. February 2023. https://doi.org/10.1038/s42949-023-00088-y.
Soman S, Beukes A, Nederhood C, Marchio N, Bettencourt LMA. Worldwide Detection of Informal Settlements via Topological Analysis of Crowdsourced Digital Maps. ISPRS International Journal of Geo-Information. 2020; 9(11):685. https://doi.org/10.3390/ijgi9110685
Brelsford, C., Martin, T., Hand, J., Bettencourt, Luís M. A., Toward Cities without Slums: Topology and the Spatial Evolution of Neighborhoods (August 29, 2018). Science Advances. Vol. 4, no. 8, eaar4644. https://doi.org/10.1126/sciadv.aar4644
Brelsford, C., Martin, T. Bettencourt, Luís M. A., Optimal Reblocking as a Practical Tool for Neighborhood Development (June 12, 2017) Sage Journals. https://doi.org/10.1177/2399808317712715
Media Coverage
The City Fix: How Higher Quality Data Can Help Improve Urban Planning and Reduce Inequities
Next City: Mapping Tech Could Formalize Settlements for One Billion People
The City Fix: Act Locally, Learn Globally: Luis Bettencourt on Building from the Community Up
Reuters: African Slum Map Exposes True Scale of Urban Poverty
Forbes: Math Helps Sprawling Cities Grow Sustainably And Reduce Slum Conditions
Mint: The City is Not a Massive Machine
To access the data, fill out our Data Sharing Agreement.